We invite you to come back monthly to see an updated summary of this website’s performance. See for yourself how many Barefoot owners are visiting barefoothoa.com.
Public Marketing Site Device Usage
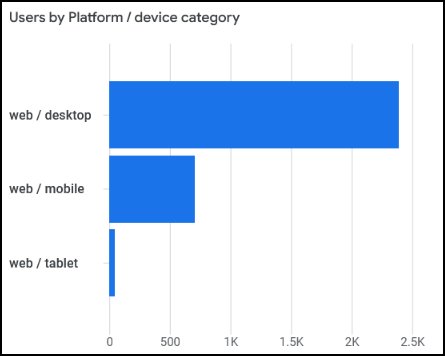
The graph below shows the device usage for February.

- 2,391 users visited the website from a desktop computer
- 708 users visited the website from a mobile device
- 49 users visited the website from a tablet
Owner Site Device Usage
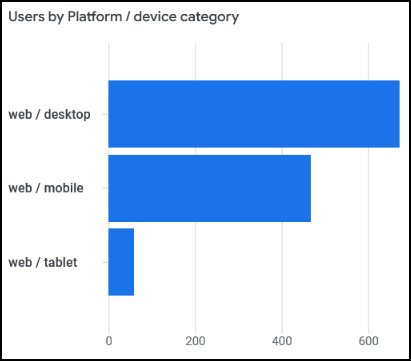
The graph below shows the device usage for February.

- 673 owners visited the website from a desktop device
- 467 owners visited the website from a mobile computer
- 60 owners visited the website from a tablet
Public Marketing Site Page Behavior
The most viewed pages after the Home Page are as follows
-
- Amenities
- Multi-Family Neighborhoods
- Barefoot Resort Residential Association (BRRA)
- Single Family Neighborhoods
- HOA Management Companies
Owner Site Page Behavior
The most viewed pages after the Home Page are as follows
-
- Webcam
- Community Directory
- Document Library
- Beach Cabana
- News
February Emails
 The eblasts with the highest open rates are as follows
- Beach Cabana Walkway at 71.5%
- Barefoot Resort Beach Cabana Update at 69.1%
- Barefoot News Center – February 2024 at 65.4%
- North Tower Spa Closure at 63.7%
- BRRA Open Board Meeting February 13, 2024 at 61.5%
Fourteen (14) eblasts were sent this month to the entire community with open rates ranging from 52.9% to 71.5%.
Fourteen (14) eblasts were sent this month to individual communities with open rates ranging from 66.0% to 84.5%.
If you have any questions or any issues logging in, please send a message to our web manager at webmgr@barefoothoa.com. She will make sure your website needs get resolved.
Owner Registrations
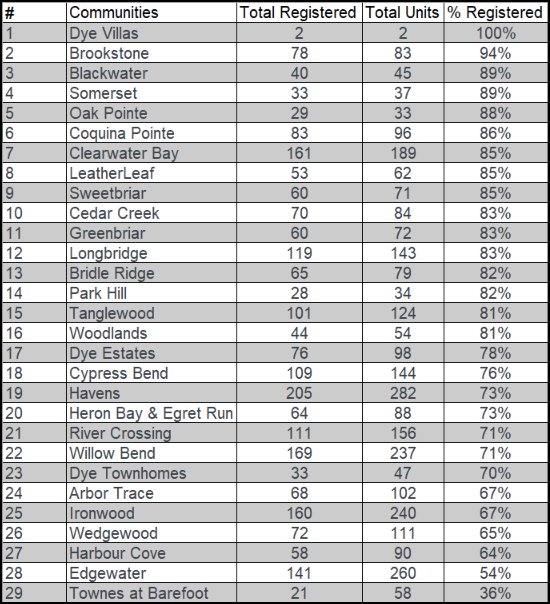
The chart below displays the total percentage of registered owners in each neighborhood.


